monotone - dot
simple representation
For monotone there are a few tools that can generate
dot graphs out of the monotone database, most notable montone-viz.
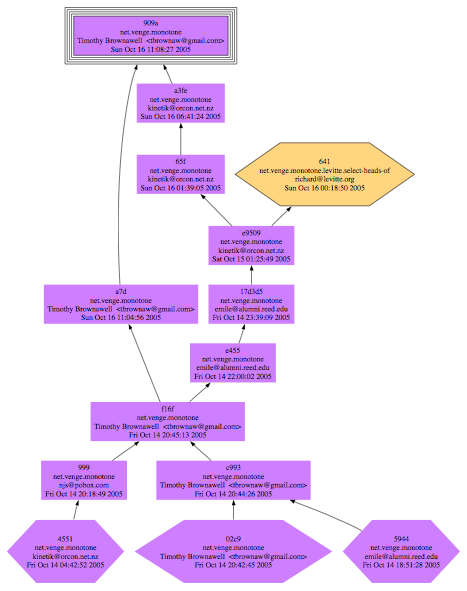
The normal way of displaying the revision graph is somewhat similar
to the following picture

In this picture the colouring depends on the branch. The current
revision is the box with the multi line border.
For the box shaped revisions all the connections are
also shown in this picture. The hexagonal revisions
can be connected to revisions outside this picture.
Finally, a revision with a single border is a HEAD.
reduced representation
Now this is very nice. But if you want to see more revisions
the picture can become enormous. A way of reducing the number
of revisions displayed but keep the essential properties
of the revision graph, is to remove all nodes that have
only one successor and one predecessor.
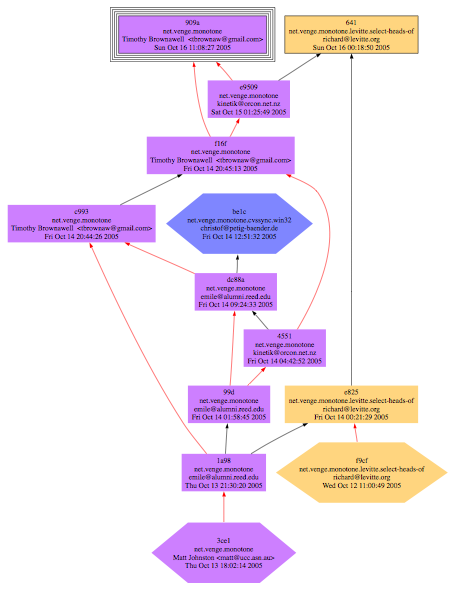
In that case the picture becomes

In this picture a red line between two revisions indicate
that some revisions are left out, but there is a chain
from the source revision to the target revision.
branches
If you see multiple heads in a single branch more as an
artifact of the distributed nature of monotone, but are
more interested in how branches interact.
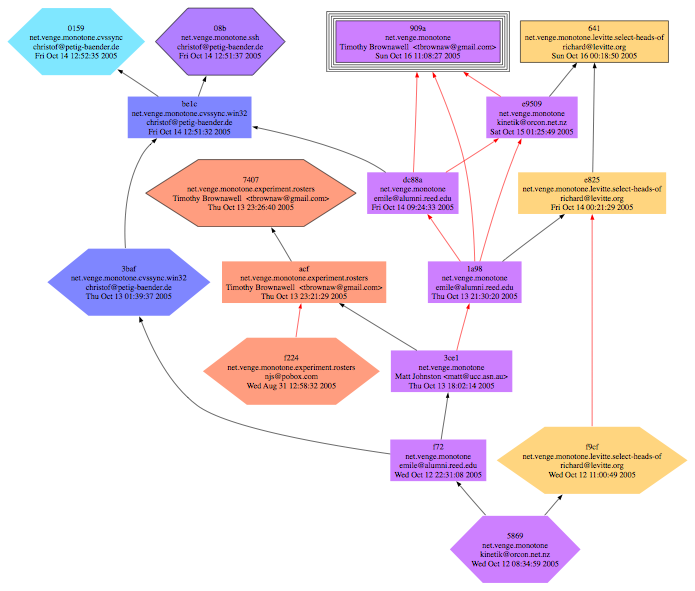
So for the following diagram the only nodes displayed are nodes
for that:
- Do not have any successor
- Do not have any predecessor
- Have a predecessor or successor in another branch
- or is equal to the current revision.

annotate
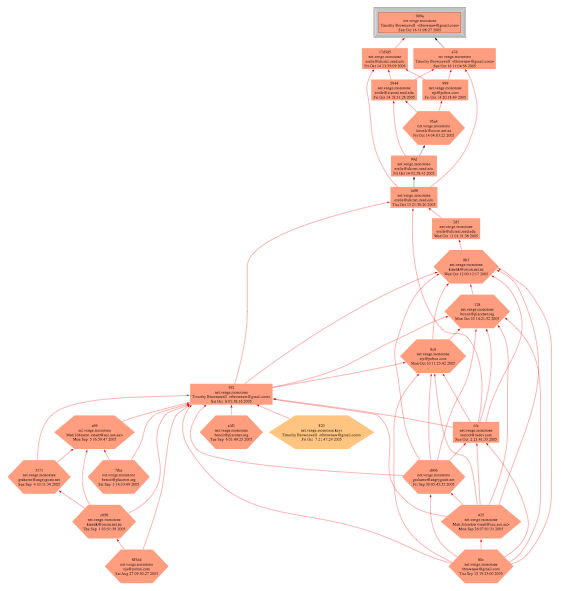
Of course you can also generate a graph based on the revisions
in which a particular file is changed. In the following diagram
that is done for the file commands.cc.

Discussion
Edge reduction?
The reductions help, but the number of edges is going to explode.
For example if you look at the branches picture there is an
edge from 1a98 to 909a. This edge is there because
there is a development path that does not go through
dc88a nor c9509. It might be very nice to know that this
happened. But if you keep on adding revisions to this picture
it will become more like the annotate picture.
In the annotate picture the number of edges makes the
diagram almost unreadable.
Annotate
The annotate diagram is too confusing. But I don't know how to make
it clearer.
Dot files


